Showing posts with label wind. Show all posts

2007-08-14

Anemometer Now Working

Further to my earlier entry, the impeller in the anemometer has started working again. Some time after 13:00 this afternoon wind speeds were being recorded again. It would appear that today's rain and wind has finally cured the problem.

I'm still not sure if this was another case of heat causing a problem (initially this seemed possible given that when it first stuck we were having some very warm days, but the last couple of days have been much cooler) or if something had got stuck and the wind and rain has finally cleared it (I have noticed some webs around the anemometer so it's possible that a spider is to blame this time). It remains to be seen if the problem will return when winds are lower than they are now.

Either way I guess that, at some point soon, I probably need to get the anemometer down and give it a good clean (not such an easy job given where it's located).

Anemometer Not Working

Last Thursday I noticed that no wind speeds had been recorded. While it was a fairly calm day we'd also had the odd breeze and I'd have expected something to have been recorded during the course of the day.

Looking at the underlying data I noticed that I was getting data from the anemometer, that the direction was being recorded and was changing (for graphing and other purposes on the main site I "ignore" directions that have 0 wind speed). Using a binocular I watched the impeller for a short while and noticed that it just wasn't spinning (I also couldn't see anything blocking it). By the looks of things this was similar to a previous case of the impeller apparently getting stuck but, in that case, it seemed to be done to heat from direct sunlight.

I've been away for a long weekend camping and, when I got back on Monday evening, I noticed that the impeller was still stuck.

Over night, and this morning, it's been wet and windy and the problem is persisting. It would appear that, whatever has caused the impeller to stick, is something serious and isn't going to be cured by a period of wind and rain. So, until I have the time to get the ladders out and take the wind vane down (which will be a fairly large job as I'll have to cut away all the ties and stuff that are keeping the cable in place), it looks like my weather station is lacking any way of recording anything to do with wind.

2007-03-21

Frozen Wind Vane?

Around 23:00 yesterday the wind vane settled on NW (315°) and sat there until around 07:00 today. I noticed this because the wind direction graph for most of this morning is a straight line:


Of course, if there's no wind at all, the vane won't move, but in that case I don't actually plot a point on the graph — I only plot a direction if there's an associated wind speed.

I suppose it's possible that for all that time the wind vane managed to record exactly the same direction but I've never seen it do this before in all the time I've been running the station. Given how much rain, hail and snow we've had over the last few days I'm wondering if the vane actually froze in place. One bit of evidence that makes me think this might be the case is the fact that the direction settled back into its normal plot (varying around a general direction) at around the same time as the Sun would have started to warm it up (around 07:00 this morning).

2007-01-18

Pictures from today's storm

As promised earlier, here are some images of the damage caused by today's storm:


Today's storm

It's very stormy today, probably the worst I've seen in a long time, easily the worst I've seen since I started running the weather station.

We've lost power three times so far today. The first couple of times were enough for the UPS to handle but the third loss looked like it was going to be a long one so I shut the machines down (hence a a hole in the data today).

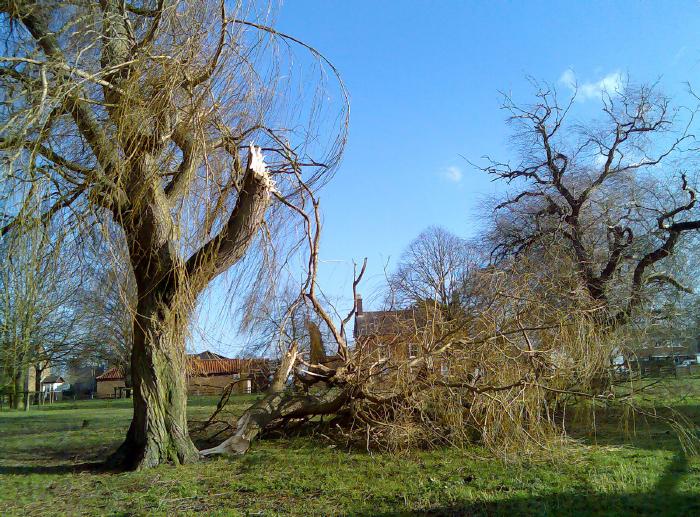
The wind during the power loss was quite scary — I'm having trouble recalling when I last saw wind like that. We appear to have lost a couple of tiles off the roof and we've also lost a garden fence. After things calmed down, but before the power came back on, I took a walk around the village to see what other damage there was and was surprised to find there was remarkably little. I saw a couple of collapsed garden sheds, a couple of collapsed fences (one of which was impaled on a tree) and a lot of debris lying around. I only saw one damaged tree (part of this Willow had collapsed).

I took my cameras with me and took some pictures. Given that I can't rely on the power at the moment (it's still blowing a gale out there and it is forecast to get worse again before it gets better) I won't be downloading them until much later.

As usual I'm not recording wind speeds anywhere near like they really are due to the design and location of the anemometer. A personal station just down the road from me is showing far more accurate speeds (showing a maximum gust of 57mph as of the time of writing).

As much as I find it all interesting, I'll be happy when it's over.

Update: Here's an image of some damage that I took on my mobile phone (like I said above, I'll grab the images off the actual cameras when everything has calmed down):

2006-12-21

Some more work on the graphs

Back in July I added some graphs that showed the last 150 days' worth of data. I wrote the code to generate them rather quickly and have not touched it since.

This evening I've made some changes to how they're generated (got rid of the user of gnuplot's smooth facility and have also added some labels) and I've also added two extra graphs: the wind chill and also the impact of wind chill (the latter being the temperature minus the wind chill).

Another windless day (and another record)

Today looks like it's shaping up to be another totally windless day. Just like a couple of days ago it's very cold, foggy, damp and gloomy (and, by the looks of things, it's even worse for large parts of the UK today).

I've also had another record for my station today. At 11:09 I recorded a pressure reading of 1040.6 hPa — that's the highest I've recorded since I started keeping data acquired from the WS3600 (the previous record for me was 1037.2 hPa, back in January).

2006-12-19

No wind?

So far today the weather station has recorded no wind. Looking back at my history a day with no wind recorded at all is a very rare event.

The only other time I've had a genuine day with no wind was 2006-06-17 (although yesterday came very close).

Unsurprisingly today and yesterday have been cold (but not as cold as it has been in Scotland), damp and foggy.

I've had a couple of other days with no wind recorded, but in both cases that was due to problems with the system. The first was on 2005-12-29 when snow clogged the anemometer, the second was 2006-07-18 when heat appeared to cause the impeller to stick.

2006-12-11

Wind distribution compass

The stats page on my weather station site has always had an all-time wind distribution table. The idea is to get some sort of idea of where the wind generally blows from at my location. While it does give that information it doesn't really have that "at a glance" feel to it that you really want.

This morning I decided that this data might also work well as a "compass graph":


I think that does a very good job of giving a "at a glance" appreciation of the data. What's really interesting is that the two main peaks are west and south-south-west. Generally the prevailing winds in this part of the UK are from the south-west so you'd expect the peak to be there. I suspect that the reason for the result you see above is that there's a house to the south-west of my setup and it's creating a wind shadow.

2006-11-27

Wind compass movie

Yet more messing about with the wind compass graph. After having it up and running for a few days I started wondering what it might look like if I created a video of the graph building up over time. This is the result:


The data is taken from 2006-11-26 and covers the first couple of hours of the day.

2006-11-23

Yet more wind compass stuff

After adding a wind compass graph to my site's graphs, and then after improving them (with a bit of help from Tim), Tim's gone and nicked the idea for his own graphs.

Not only that, he's gone and added lots of cardioid graphs too. I'm not sure what they tell me, but they look kind of fun.

More work on wind graphs

After adding the wind compass graphs earlier today I started thinking again about the problem of averaging the wind direction. Being able to produce a useful rolling average helps with the turbulence problem I get with high wind speeds and the compass plots had a minor bug in them when the wind was moving either side of north.

So, after a little bit of searching around on the net and not coming up with anything that useful (maths really isn't my thing so I find it quite hard to make sense of most materials), I hassled Tim and he came up with a couple of useful pointers.

A little bit of hacking on rollavg later and, I think, it's all working. I can now do rolling averages on wind directions and it doesn't seem to all fall apart when the wind is coming from somewhere up north (yes Tim, the pun was too good to miss ;)).

I've now tweaked the compass plots to show both 20min and 60min rolling average values and I've also reintroduced the rolling average lines back into the old wind direction graphs.

Hopefully, this time around, it'll all work sweet.

New graphs and a new record

This morning I added a new type of graph to the graphs for today and yesterday. It's somewhat similar to the wind direction graph but, instead of showing the direction left to right, it plots it as a compass.

Edit: I've now added a compass graph for the last 7 days too.

I also had a bit of a record this morning. At 05:02 I recorded the lowest relative pressure value I've seen since I started running the station. The value was 972.4 hPa, just lower that the last record of 976.7 hPa on 2006-02-17 at 03:37.