After adding the wind compass graphs earlier today I started thinking again about the problem of averaging the wind direction. Being able to produce a useful rolling average helps with the turbulence problem I get with high wind speeds and the compass plots had a minor bug in them when the wind was moving either side of north.
So, after a little bit of searching around on the net and not coming up with anything that useful (maths really isn't my thing so I find it quite hard to make sense of most materials), I hassled Tim and he came up with a couple of useful pointers.
A little bit of hacking on rollavg later and, I think, it's all working. I can now do rolling averages on wind directions and it doesn't seem to all fall apart when the wind is coming from somewhere up north (yes Tim, the pun was too good to miss ;)).
I've now tweaked the compass plots to show both 20min and 60min rolling average values and I've also reintroduced the rolling average lines back into the old wind direction graphs.
Hopefully, this time around, it'll all work sweet.
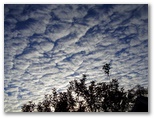 Although I've not done much in the way of weather photography I do try and snap interesting things when I see them. Because of this, and because I want to try and do more weather photography, I've added a weather photography section to my weather station website.
 This morning I added a new type of graph to the graphs for


